New program poised to revolutionize PIC performance analytics
By Xander Schwartz
Pine Island’s position at the pinnacle of summer camp excellence is well-established and in no danger of diminishing, but several months ago, my associates and I became aware of a potentially disturbing development. The details are hopelessly technical and need not be repeated here, but the overall trend was worryingly clear: Quantification of the camp experience (never particularly robust even in the pre-internet age) had been neglected for years and become woefully inadequate—not even remotely next-gen in comparison to the competition.
The situation was so dire that there was no time to consult (or indeed, even inform) the Board of Directors or anyone else in the PIC leadership. Instead, recognizing the need for immediate action, my colleagues and I promptly formed our new organization; wrote, debated and ratified a number of impressively detailed founding documents; and got straight to work.
Since that momentous day, our team at PINE SAP (Pine Island’s Newly Exhaustive Statistical Analytics Program) has been laboring diligently; collecting advanced data under the watchful eyes of Zommule of Zim, the Omnioccular Wiggly Ziggler; running Spamson the Somnolent Sloth’s painfully slow, yet highly advanced models; and crunching advanced numbers with Glubb the Gourmandizing Grouper day in and day out. A dizzying array of projects remain in the works, but thankfully (and just in time for this year’s Pine Needle) PINE SAP has managed to complete its first report on an activity central to the camp experience: Dustball.
The question has lingered in the minds of dustball players for years: “Do LTIPs really throw as hard as it feels like they do?” Well, analysis of over two decades of relevant data has found the answer to be a resounding: YES!
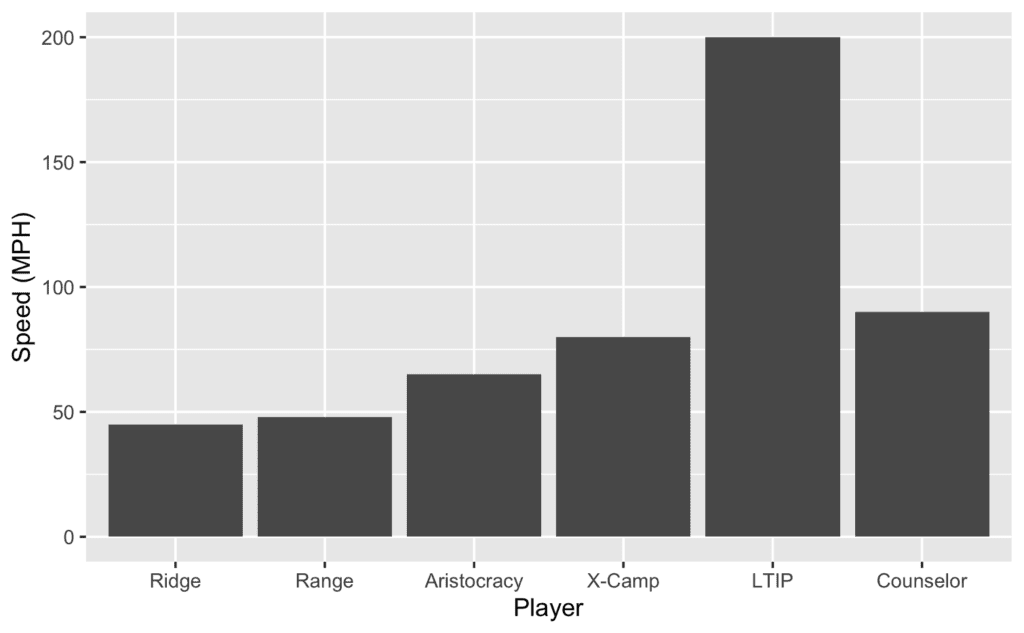
As the above figure shows, the average LTIP beams the ball across the Dust Court at more than twice the speed of even the average counselor, and faster than the average Ridge, Range, and Aristocracy camper combined. Our analysts recommend taking shelter behind a larger camper whenever an LTIP gains possession of the ball.
But as any experienced dustballer knows, velocity is not the only relevant factor. Movement of the ball in flight is just as important, and this past summer, we finally acquired the technology to measure this with adequate precision.
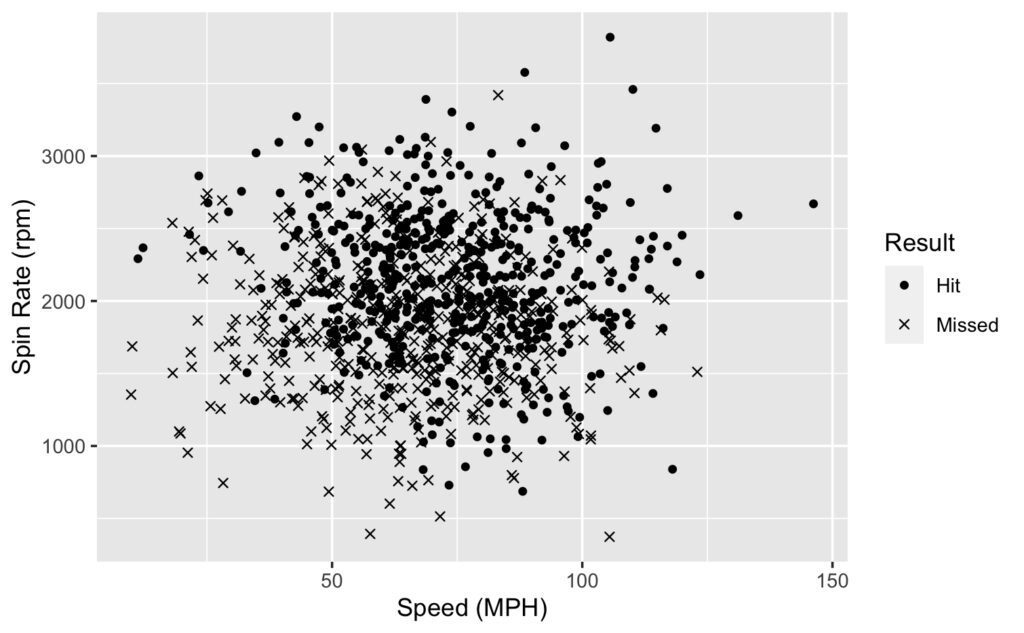
As the above figure shows, a higher spin rate on the ball led to a markedly increased chance of successfully hitting an opposing player. The reasons for this cannot yet be definitively stated, but our analysts believe that the added unpredictability of the ball’s flight path causes the targeted player to lose precious milliseconds as they try to decide which dodge to employ. In any case, as these insights are put into practice on the Dust Court next summer, we expect to see a dramatic increase in average spin rate—along with a corresponding spike in instances of the ball ending up in the lake as overzealous young campers attempt to achieve maximum RPM.
That’s all for now, but stay tuned! PINE SAP’s mission has just begun, and it will not be complete until we have provided next-gen statistical analysis of all aspects of camp life. The digital revolution is here, and we will not rest until PIC is at the absolute cutting edge of summer camp performance analytics.
Till next time, Akka Lakka!
Xander Schwartz, K.D.
PINE SAP Founder and COO (Communications Optimization Officer)